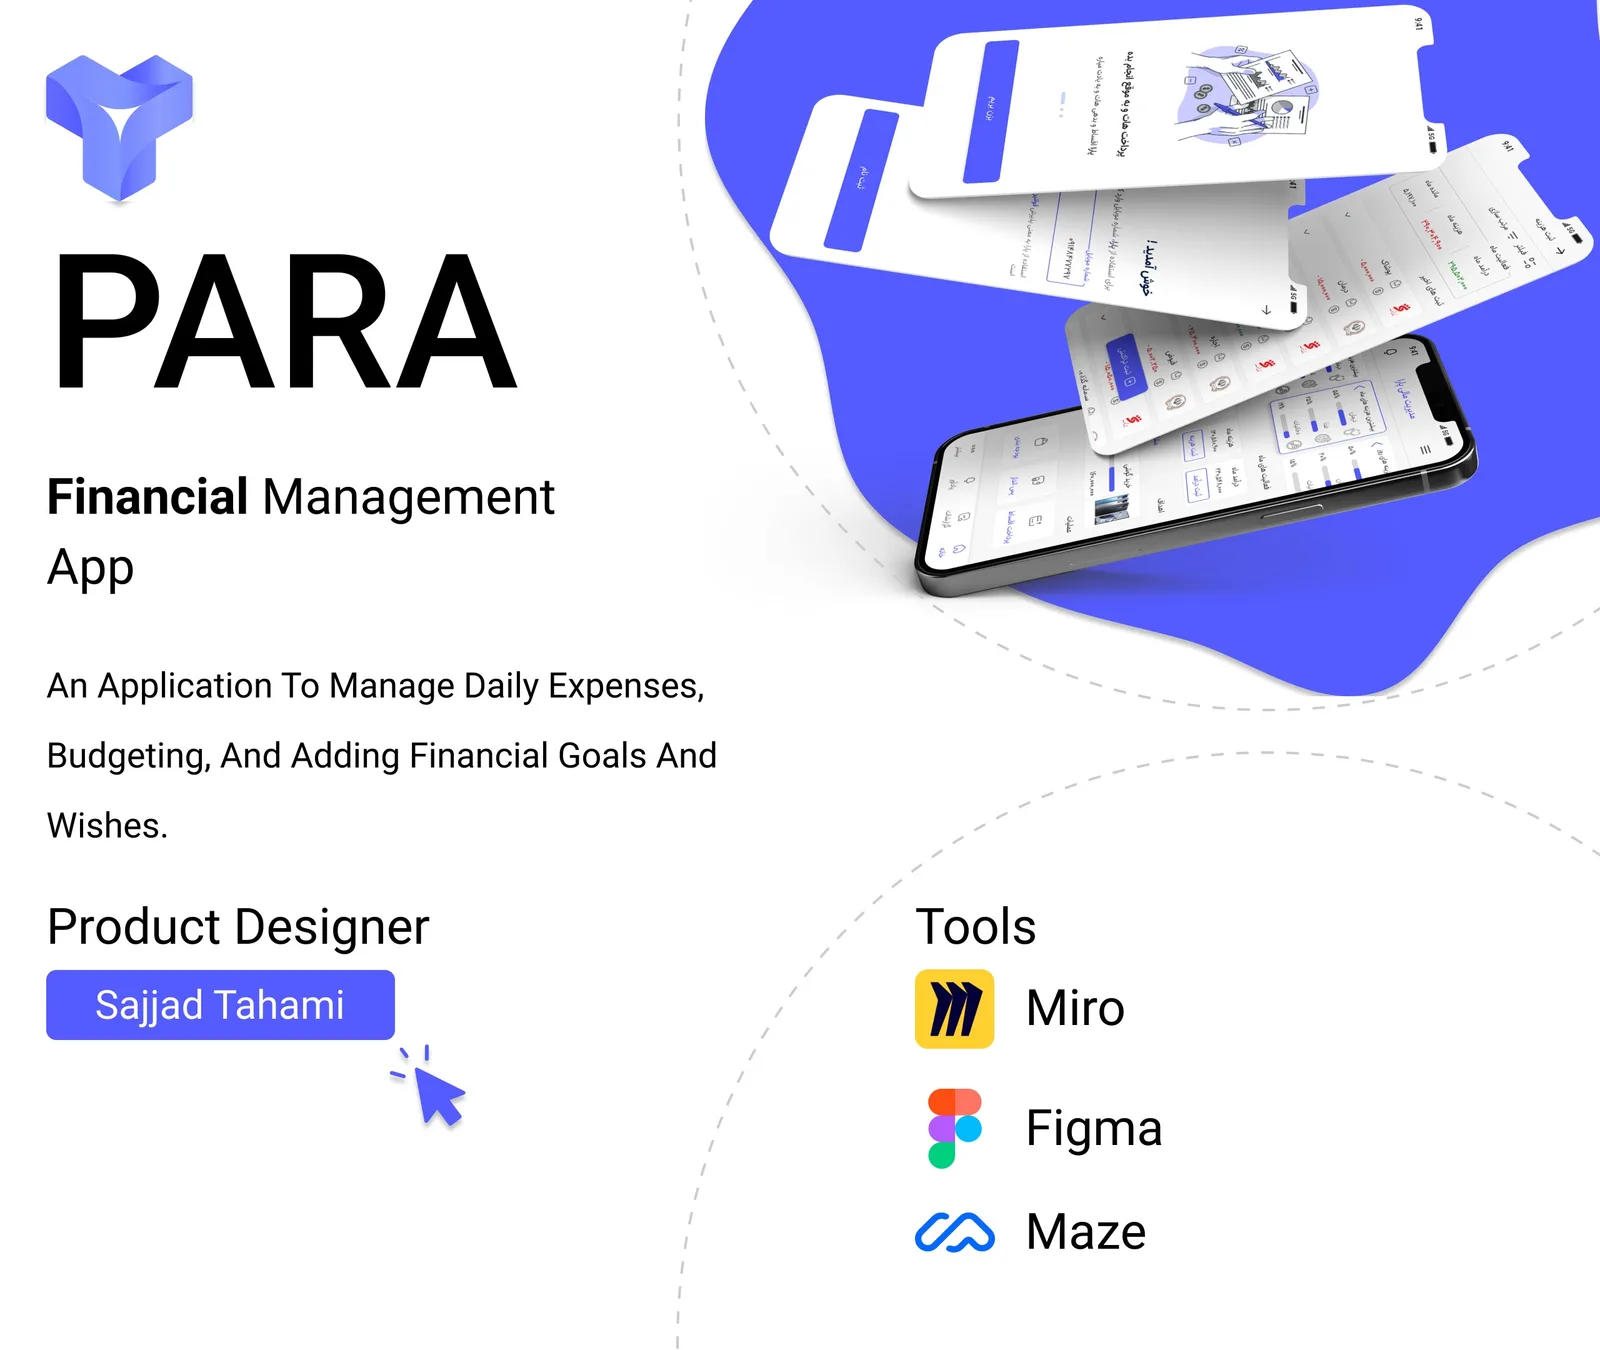
Case study · Course project
Para
A financial management app for high-inflation times
- Role
- Product Designer
- Context
- Course project
- Tools
- FigmaMaze
The result, first
What changed because of this work
86%
Task success, up from 48.5%
-41%
Task time, 63.8s to 37.4s
82
SUS score, up from 59
12%
Misclick rate, down from 26.6%
Task success rate
+77%Average task time
-41%Misclick rate
-55%Bounce rate
-63%First-try navigation
+59%SUS usability score
+39%01
Context
The problem
A training project from Ali Babaei's product design course: a financial management app. The goal was to understand why users struggle with saving, budgeting and controlling daily expenses during high inflation.
What was broken
Users struggle with saving, budgeting and managing daily expenses in a high-inflation environment.
02
Approach
How I got there
01
Interviews with 10 users and a quantitative survey with 12 responses.
02
Competitor benchmarking.
03
A Maze usability test with 32 participants.
04
Multiple design iterations in Figma.
03
Thinking
Key decisions
I decided to
Simplify categories and navigation
Because
First-try navigation accuracy was only 49% and 26.6% of taps were misclicks.
I decided to
Shorten the steps for cost registration and budget tracking
Because
Tasks took 63.8 seconds on average and only 48.5% were completed successfully.
04
Impact
Results
- Task success rate: 48.5% to 86%.
- Average task completion time: 63.8s to 37.4s (-41%).
- Misclick rate: 26.6% to 12%. Bounce rate: 9.1% to 3.4%.
- First-try navigation accuracy: 49% to 78%.
- SUS usability score: 59 (below average) to 82 (excellent).
- User comprehension of financial charts improved by 47%.
The craft
Screens
What I took away
The numbers show that the new navigation and shorter flows worked in a controlled test. They are a design signal from a course project, not a market result.
How far to trust these numbers
- The usability test was a Maze test with 32 participants, so the sample is small.
- The research behind the problem was 10 interviews and a survey with 12 responses.
- It is a training project, so there was no real launch and no business metric such as retention or revenue.